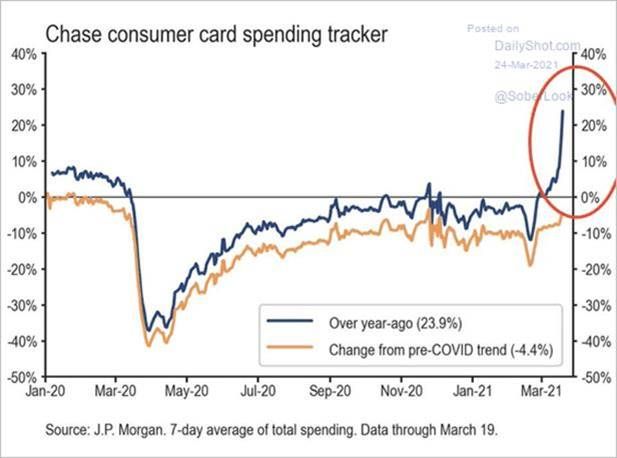
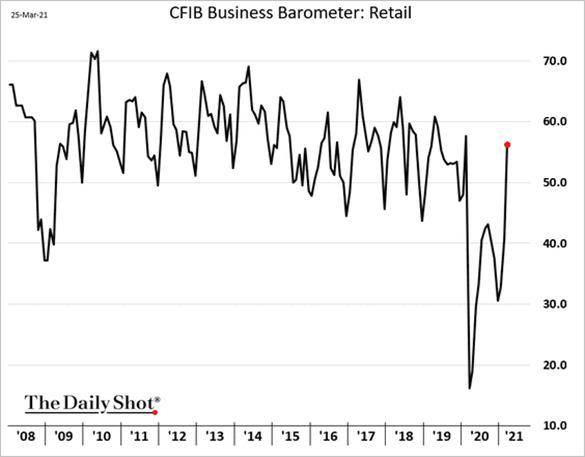
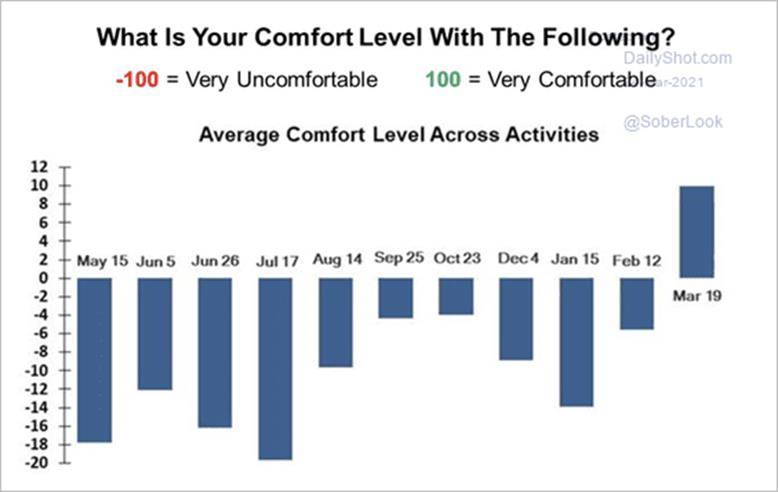
The U.S. consumer is starting to awake after a long winter’s sleep.
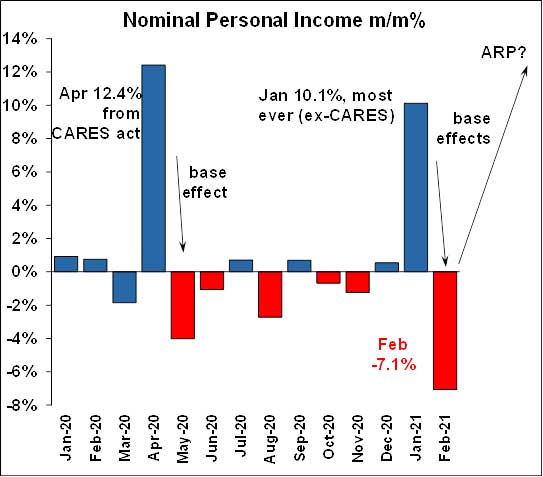
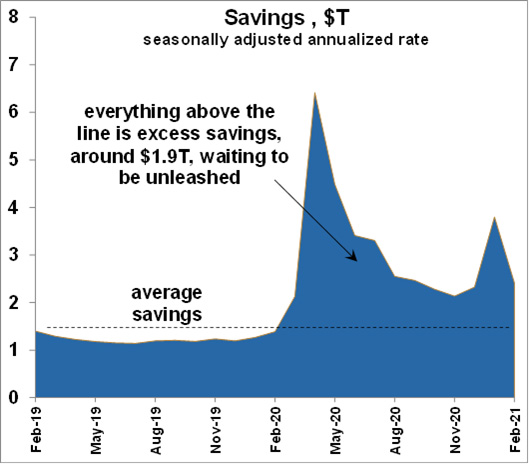
Let’s start with those charts on personal income (PI), personal consumption expenditures (PCE), and excess savings again. February’s PI/PCE report looked bad but it was a fake-out. Personal income fell -7.1% m/m, but that was expected because the prior month, January, had such a huge boost from the Consolidated Appropriates Act (CAA) which was the $900B stimulus act passed in December 2020. It’s an example of what’s called the base effect, which means that a month/month change can be distorted based on what happened in the prior month.
For example, let’s say income in the first month was $100, and income in the second month was $99, then the m/m change would be -1%. But suppose income in the first month had been $1,000 and income in the second month was $99 like before. That would result in a m/m change of -99%. The income level in the second month was the same in both cases, but it was the income in the first month which created the distortion, and that’s what happened with PI in the February report. Stimulus checks from the CAA boosted PI by a gigantic $2.4T (annualized rate) in January. But by February, most of the CAA checks had gone out, resulting in a dramatic loss in PI, largely due to the distortion from the base effect.
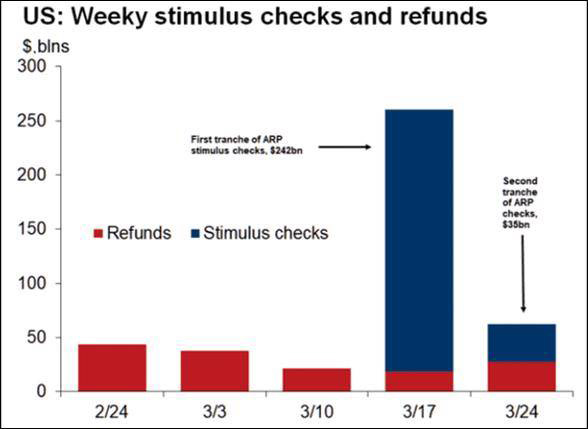
But, it goes both ways. So next month (April 2021) we are going to see a gigantic increase in PI from the $1,400 checks of the American Rescue Plan (ARP). The point is, PI is to come roaring back in the government’s March report. In fact, a private (non-government) more up-to-date report from Oxford Economics / Haver Analytics, shows that it actually has.


