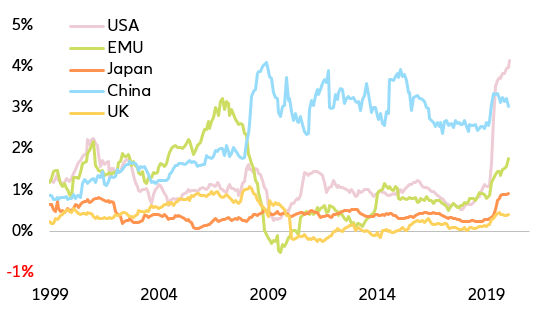
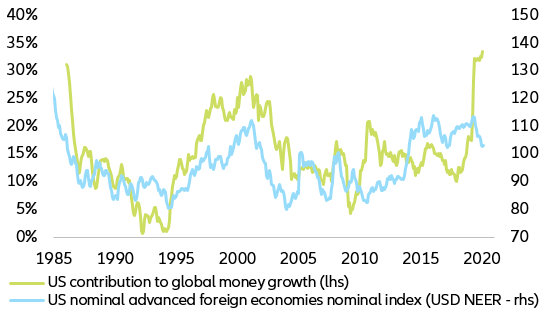
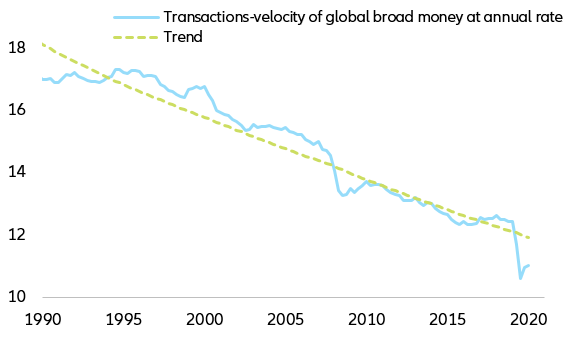
But in a world where monetary capital is largely free to move from one place to another, the right questions to ask are rather the following: how fast is the global stock of money growing? Is there a discrepancy between narrow and broad money growth? Which countries or regions contribute the most to money growth? And what about money velocity, the often overlooked variable that can amplify or dampen the impact of money growth?
Measuring global money poses four problems. First, the definition of money is elusive. As Walter Bagehot quipped: “Men of money know how to count; what to count they do not know”. And, according to Goodhart’s law, as soon as a certain money aggregate becomes a policy variable, experience shows that regulatory arbitrage gives birth to a new and generally broader aggregate. For this reason, it seems appropriate to monitor both extremes of the money spectrum: the monetary base (i.e. currency and bank reserves at the central bank) and broad money (currency, bank deposits and money market funds).
Second, while the definition of the different money aggregates is relatively standardized, not all countries publish the same data over the same period: for example, since 2006, the Federal Reserve has stopped tracking M3, the broadest aggregate monitored by the ECB. Adding M2 in one country to M3 in another one may look like adding apples and oranges. But as the distortion it introduces is almost constant through time, it is an acceptable one.
Third, there is a trade-off between the number of countries taken into consideration and how far back in the past one can aggregate national data. Bearing this trade-off in mind we look at China, Canada, the EMU, Japan, the UK and the US for the monetary base, and add Australia, Brazil, Hong Kong, India, Indonesia, Malaysia, Mexico, Philippines, Singapore, South Africa, South Korea, Sweden, Switzerland, Taiwan and Thailand for broad money. This selection makes it possible to aggregate national data from 1986 onwards.
Last but not least, since we want to measure the rate of growth of global money, we must make sure that changes in the relative prices of its components do not blur our measurement. Whichever currency we choose as the accounting unit, say the USD, we must ensure that fluctuations in the exchange rates of the Euro, the Chinese Yuan, the GBP etc to the USD do not impact our measurement. Failing to do that, a weak dollar would artificially boost global money growth. As it would, by the same token, artificially boost the global GDP measured in USD, it would not necessarily mean that the supply of money has increased relative to its demand. Formally, the problem of eliminating the impact of currency movements is akin to measuring the rate of inflation of a basket of goods, the composition of which changes over time, a problem solved by Irving Fisher in 1927 with his eponymous price and volume indices.
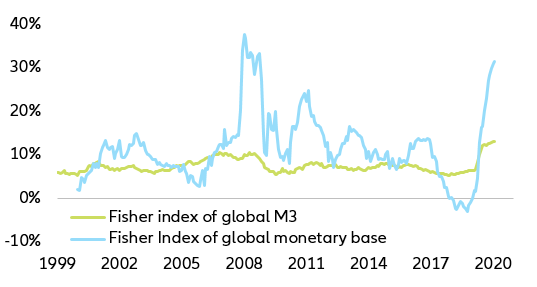
The OECD does not provide such a Fisher volume index for the monetary base at the OECD level, but it does so for M3. According to this index, the OECD M3 was growing at an annual rate of +18.4% in November 2020, up from +5.8% in February. However, by design, this index does not account for money growth in non-OECD member countries such as Brazil, China, Hong Kong, India and Taiwan. Yet, these countries, China first among them, are not small players when it comes to global liquidity. To the best of our knowledge, neither the IMF nor the BIS compute Fisher volume indices for the monetary base or broad money at the global level. This is why we have constructed the following proprietary indices.
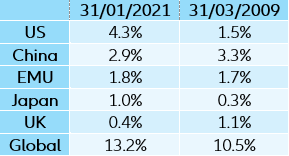
At the end of January 2021, global broad money stood at USD106.7trn. As shown in Table 2, five of the 21 countries selected accounted for about 80% of global money. In money matters, too, the 80-20 rule, also known as the Pareto principle, seems to hold.
Table 2: Shares of global broad money

