Executive summary
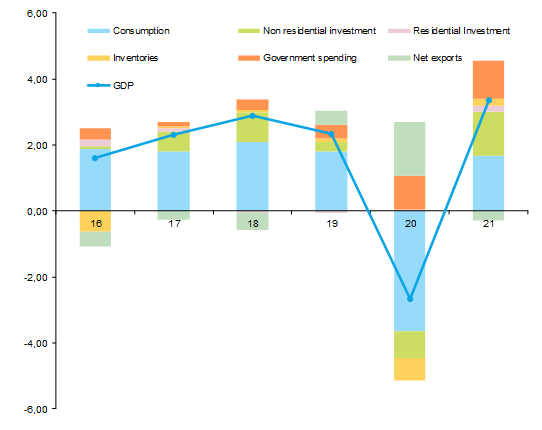
High frequency data and the news flow from the U.S. allowed us to have a better sense of the size of the Covid-19 shock, the reaction of public authorities and upcoming ripple effects. In this context, we revise our U.S. GDP growth scenario from +0.5% y/y to -2.7% y/y in 2020.
- The largest shock on the U.S. economy since 1947. We expect the contraction of activity to reach -30% q/q annualized in Q2 2020, representing two times the cumulated contraction of 2008-2009. We now expect two months of social distancing (March and April) instead of one month only, with a progressive albeit delayed recovery thereafter.
- A U-shaped recovery remains our central scenario. The size and design of monetary supportive measures suggest that a recovery will begin from Q3 2020 onward and gain steam in Q4 2020, allowing a rebound of growth at +3.3% y/y in 2021. However, this rebound will have a cost in terms of the deficit, expected at 9.6% of GDP in 2020 and 8.5% of GDP in 2021. We still believe that a L-shaped scenario, representing a cumulated loss in terms of value-added of USD 5.5 trillion at a horizon of four years, instead of USD 1.9 trillion in our central case, has a lower probability.
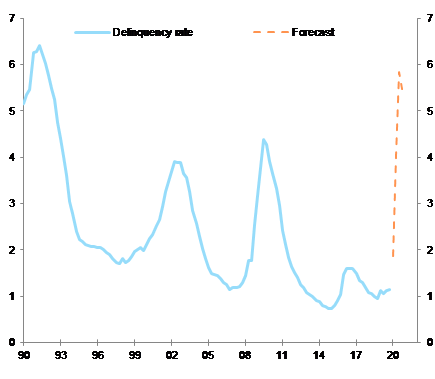
- The delinquency rate (loans more than 30 days past due) of U.S. companies on commercial and industrial loans is likely to reach a record high of 6.5% at the end of the year, the highest since 1992. However, the size and structure of the stimulus (equivalent to a vast system of credit guarantees) and the cash position of U.S. companies will allow a smaller progression of insolvencies compared with the subprime crisis (we expect a +25% rise of insolvencies in 2020 against +47% in 2008-09).
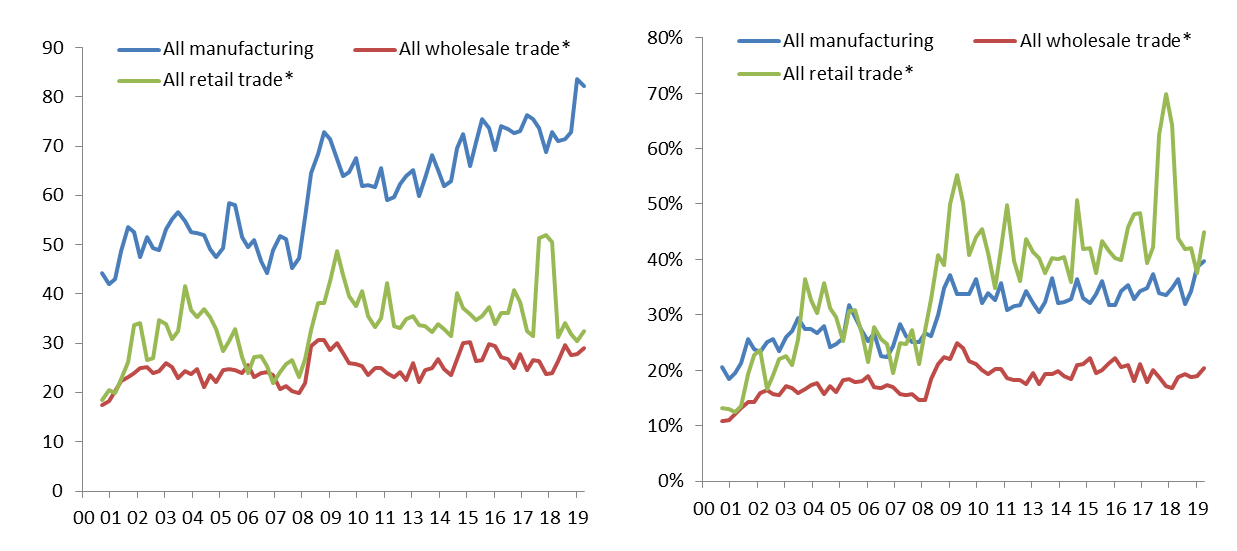
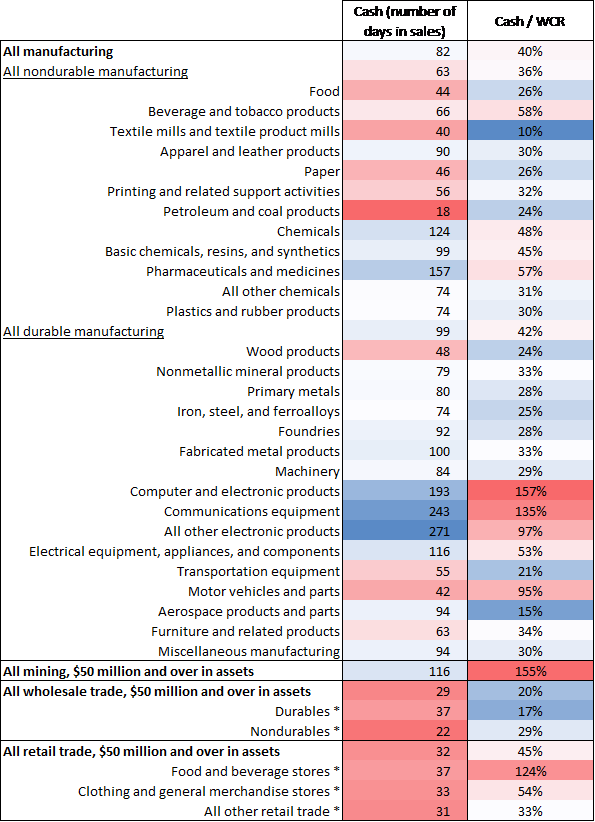
- U.S. companies in the wholesale and retail sectors are the most at risk from the pause in sales as they had, on average, less than one month of turnover available in cash prior to the crisis. In manufacturing activities, the most exposed sectors are petroleum and coal industries (18 days of turnover available in cash), food (40 days), textiles (44 days) and the paper industry (46 days).
The size of the Covid-19 shock in the U.S.: more than -30% q/q annualized contraction of activity in Q2 2020
The brutal interruption of economic activities is unique in modern history. In order to measure the size of this shock, we assumed at the beginning that the U.S. would follow the path of China, meaning a contraction of activity below its trend level for a full month, followed by a progressive recovery thereafter. However, high-frequency data from the U.S., in particular job data, soon revealed that we were too optimistic. Looking at initial claims data, released on a weekly frequency, showed more than one million people claiming unemployment benefits in the last two weeks of March. Now, we look into translating this impact on the U.S. job market into losses of value-added.
A stable relationship exists between initial claims and nonfarm payrolls. Assuming that initial claims would remain above two million for two months after March, and that a progressive recovery would take place thereafter, gives us a loss of 15 million jobs before year-end. Assuming that the active population remains on its trend of progression, we estimate that the U.S. unemployment rate would reach 13.5% at the end of the year compared with 4.4% in March and 3.5% in February, when the adjustment of job market conditions effectively started.
In order to estimate the losses in terms of value-added, in terms of growth, we utilize the so-called Okun law, which describes the long-term relationship between growth and unemployment. According to our own estimate of this law, a jump in the unemployment rate from 3.5% to 13.5% should be the result of a significant decline of growth from 2.5% y/y in Q4 2019 to a trough of -8.6% y/y in Q2 2020. In these circumstances, U.S. GDP growth would contract by -2.7% y/y in 2020 compared with its growth of +2.3% y/y in 2019. This represents a significant downward correction compared with our prior scenario for 2020 at +0.5% y/y. However, our sensitivity analysis already identified the fact that switching from a one-month to a two-month confinement (social distancing in the U.S.[1]) was enough to anticipate a much lower level of growth. We now anticipate two months of social distancing and a delayed de-confinement, meaning that the U.S. would only return to its level of activity before the Covid-19 crisis in the middle of Q4 2020.
Figure 1 – Contribution to U.S. GDP growth (pp)

