Executive Summary

  • The Euler Hermes Enabling Digitalization Index (EDI) measures the ability – and agility – of countries to help digital companies thrive and traditional businesses harness the digital dividend. This is the third edition of our ranking (a score from 0 = worst to 100 = best). The score is based on five components: Regulation, Knowledge, Connectivity, Infrastructure and Size.
  • In our 2019 ranking of 115 countries, the U.S., Germany and Denmark are the top three “digitagile” ones.
  • The best improvements from last year’s ranking are seen in Denmark, which moved up nine ranks, replacing the Netherlands on the podium this year; in China, which rose eight ranks to  feature in the top 10 for the first time and in New Zealand, which edged up to 14th place (up from 22nd last year).
  • Strategies to enable digitalization differ across countries: We identify three strategies for digitalization that have been used over the past year:
  1. Emerging Markets (EMs, namely China, India, Turkey, Kenya, Brazil and Morocco) played their cards right. Improving regulation was the preferred channel for digital enablement to accompany an increase in size. This improvement came at a time of financial stress for such markets as the U.S. Federal Reserve was hiking interest rates and drying up global liquidity. This, along with the uncertainty shock created by President Trump’s trade tariffs, can explain EMs’ pressing need to improve their attractiveness to investments to accelerate digitalization.
  2. Countries that already had a strong regulation score focused on more costly components of the EDI, such as knowledge. This was the case for many advanced economies (Italy, Spain, Germany, Canada, the UK, South Korea and the U.S.).
  3. Lastly, smaller countries which could not bank on size and already had good regulation and knowledge scores focused on connectivity to provide an appropriate environment for digitalization. This is the case in Denmark, Singapore and Ireland, but also small Eastern Europe and Latin American markets.
  • Where is the untapped potential? We compare our EDI with seven existing digital adoption indicators. We find that several countries have a lower digital adoption than what the EDI score would suggest, including Austria, France, Spain, South Korea, Switzerland, Germany, Luxembourg, New Zealand, Norway, Sweden and the UK. These are countries where the EDI is high, but where existing proxies for digital adoption suggest that companies have not yet fully embraced digitalization.
  • The optimal strategy for these countries would be to focus on knowledge: Out of our EDI subcomponents, we identify those that are significantly correlated with digital adoption. In the case of tech market capitalization, cloud computing, big data and e-orders, the knowledge score — comprising skills indicators (higher education and training, digital competences) and data on innovation capabilities (R&D spending, scientific publications) — is the most significantly correlated.
Why should companies care about this year’s ranking?

Prepare for the digital war: First, the Chinese breakthrough in our ranking is a wake-up call, and can partly explain the escalation of the trade feud between the U.S. and China into a tech cold war. Merchandise trade disputes are just the tip of the iceberg, and tariff hikes can be reversed. But recent sanctions on Chinese smart device manufacturers and infrastructure providers could herald a structural inward shift in the digitalization process in both the U.S. and China, as well as the “geo-politicization” of the race for the deployment of 5G technology. Our ranking shows which countries will be able to compete in this digital war to become hubs for the development of digital technologies. And comparing our index with existing digital adoption indicators identifies hidden “digital gems” which could provide an appropriate environment for the digitalization of companies but still have untapped potential, and hence lower barriers to entry.

A systemic sector and the rise of new risks: The digital economy now accounts for an increasingly large chunk of the global economy (more than a fifth of global GDP). In the U.S., retail e-commerce rose by +13.7% in 2018 (after +16% in 2017), compared to +4.6% for the overall retail sector (after +4.5% in 2017). In China, online retail increased by +29% (after 39.3% in 2017) compared to +3.8% for the overall retail sector in the same period (after 10.3% in 2017). Global Information and Communication Technologies (ICT) services exports – which include computer, communication and information services – rose to 10.5% of total services exports, up from 6.3% in 2004 and 3.1% in 1995. Yet the universality of the digital sector puts it at risk of a potential confidence crisis. The more a country embraces digitalization, the more it is exposed to new waves of cybercrime, ransomware, hacking of critical infrastructure and vulnerabilities of smart manufacturing. Despite increasing their numbers of secure servers and improving regulation, the best performing countries are de facto more exposed to these new risks.

Creative destruction and insolvencies: Finally, identifying countries with the best progression in the EDI ranking suggests the potential for creative destruction that could take place in the next few years, i.e. the possibility for an accrued number of company insolvencies in sectors that are highly sensitive to technological disruption, such as retail. In France, for instance, a new wave of knowledge-based investment is simultaneously causing business creation (+15% in 2018) and rising insolvencies (+6.6%) in sectors such as agrifood, retail, accommodation & catering, transportation and other services (France: Rise of the Machines, April 2019).

In the headlines: Best performers

The U.S., Germany and Denmark on the podium

The U.S., Germany and Denmark make the top three of the 2019 edition of the EDI[1]. Once again, the U.S. leads by far due to its best in class knowledge ecosystem, competitive market size and favorable regulation. Not only do U.S. companies already benefit from the best conditions for digitalization, but the connectivity quality is still improving, with an exponentially increasing number of secure servers[2]. The only cloud on the horizon is the infrastructure score, which declined from last year. This highlights the need for the U.S. to strengthen its logistic infrastructure and competence.  

Germany keeps its second place, with the best knowledge ecosystem (tied with the U.S.) and infrastructure for trade. It saw a marked improvement in both connectivity and knowledge scores. Denmark is the newcomer to the podium, relegating the Netherlands to fourth place. This move can be explained by Denmark’s unique connectivity improvement, coupled with better infrastructure. Indeed, Denmark nearly tripled its number of secure servers (700,000) to a higher number than Brazil or China, and close to that of Russia. At the same time, its infrastructure score improved, thanks to a better timeliness of trade shipments and better technology to track and trace consignments.

China, rising to the top 10

China makes a booming entrance to the top 10 at 9th place, up from 17th place in 2018. The explanation lies in the country’s regulation score, as China made starting a business much easier and shorter (nine days) by removing lengthy procedures; in this, it has reached the level of high-income OECD countries. Other improvements in paying taxes, registering property and protecting minority investors also helped boost the score. Such progress in regulation is in line with China’s ambitions to be a digital leader. The “Made in China 2025” strategy aims at targeted investments in research and development (R&D) and an emphasis on technological innovation. This suggests we should see the country’s knowledge and connectivity scores rise significantly in the next few years. Not to mention that the size of the Chinese market enables companies to scale up their businesses easily and strengthen Chinese “self-dependent” innovation, rather than replicating Silicon Valley companies. In the future, we can also expect China’s regulation score to reflect the proposed progress in intellectual property protection and technology transfer.

Different strategies for digital enablement

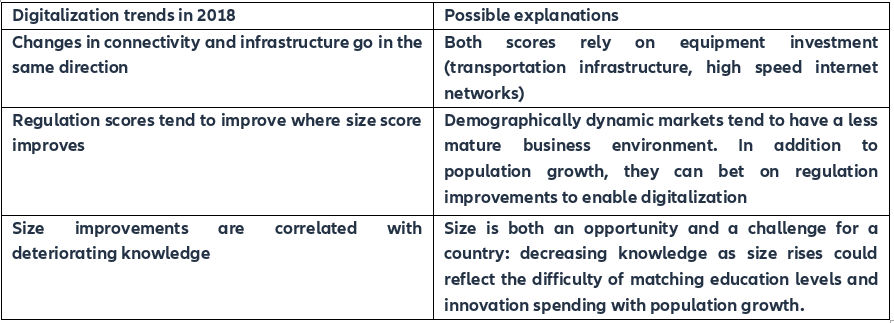
In our sample of 115 countries, we identify different digitalization trends in 2018. This allows us to classify country progress into three digital enablement strategies:

Figure 1: Three digitalization trends
Source: Euler Hermes Rating

Strategy one is the most straightforward strategy: banking on regulation improvements along with a size increase. This is a useful strategy for many countries with fast-growing populations and relatively early levels of industrialization.

o    In 2018, as per the EDI, Emerging Markets (EMs) such as China, India, Turkey, Kenya, Brazil and Morocco played their cards right. Improving regulation was the preferred channel for digital enablement in EMs to accompany a market size increase. This improvement came at a time of financial stress for such markets as the U.S. Federal Reserve was hiking interest rates and drying up global liquidity. This, along with the uncertainty shock created by President Trump’s trade tariffs, can explain EMs’ pressing need to improve their attractiveness to investments to accelerate digitalization.

Strategy two is the connectivity and infrastructure strategy, which is more costly as it involves spending efforts on logistics for trade and better penetration of technological equipment.

o    Smaller countries which cannot bank on size and already have good regulation and knowledge scores focused on connectivity and the investments it requires to provide an appropriate environment for digitalization. This was the case in Denmark, Singapore and Ireland, but also small Eastern Europe and Latin American markets. As trade hubs are going through challenging times amid escalating trade tensions, they have had to increasingly rely on domestic demand, which explains why infrastructure spending is becoming a major part of their economic stabilization tools.

Strategy three is the most advanced one as it relies on knowledge: offering better education to adapt the workforce to the digital transformation, investing in R&D, etc. Strategy three can feed a renewal of strategy two.

Countries that already had strong regulation scores and solid infrastructure and connectivity focused on knowledge, a costly component of the EDI. This is the case for many advanced economies (Italy, Spain, Germany, Canada, the UK, South Korea and the U.S.).

Regional focuses

Western European countries are highly ranked and still have some gas left in the tank

Unsurprisingly, Western European countries still rank high on the EDI, accounting for six out of the ten best digital enablers. The Nordic countries are the best represented, namely Denmark (ranked 3rd), Sweden (10th), Finland (13th) and Norway (20th); they balance their poor size scores with the best knowledge, regulation and infrastructure scores. Overall, the Eurozone’s total R&D spending (accounted for in the knowledge score) stands at 2.0% of GDP, against 2.8% in the U.S., 2.1% in China and 2.4%  on average in the OECD. R&D is more concentrated in the manufacturing sector in Europe and China, unlike in the U.S., where financial services attract a higher share of total R&D spending. However, a divergence among Eurozone countries also persists, with R&D spending above the U.S. average (which is the 9th highest worldwide) in Sweden, (3.3%), Austria (3.1%), Denmark (3.1%), Germany (3.0%) and Finland (2.8%).

Several core European markets saw their digitagility improve last year, mostly driven by progress in knowledge: France is up two places to rank at 17, Spain up three places to rank to 24 and Italy up one place to rank to 28. Yet R&D spending still lags peers in France (2.2%), Italy (1.3%) and Spain (1.2%). Among the trade and financial hubs, Switzerland loses three places and ranks 7th and Luxembourg loses 11, ranking 25th: they could not keep up with the pace of average connectivity improvements around the world, and their infrastructure quality declined. Portugal, a trade hub in the making, gained two places (ranking at 30), thanks to continued infrastructure improvements and connectivity efforts. This was the same for Ireland, whose connectivity efforts offset the decline in its infrastructure score (21st place).


Asia Pacific: winners and losers
The third best-performing block once again stands out with Singapore (6th), Japan (8th) and China (9th) in the top 10, but it shows heterogeneity. What were the winning strategies? China banking on regulation, Singapore boosting connectivity (gaining two places to rank 6th) and Thailand focusing on infrastructure and market size (gaining five places to 40th). But such progress is mirrored by the fall in rankings of South Korea (six places to rank 16th), Hong Kong (two places to 11th) and Malaysia (three places to 33rd), due to declines in the infrastructure score and also connectivity for South Korea. Despite their ever-increasing market sizes, India maintained its 44th place and Indonesia lost two places, falling to 62nd out of 115 countries. For India, the culprit is its low connectivity score, with fewer secure internet servers per hundred people than Bulgaria, Ukraine or Brazil. The use of the internet, albeit massive in absolute value, is still not widespread (35% of the population against 48% on average in the world).


Central and Eastern Europe: jumping on the bandwagon
Spread between the 26th and 70th rank (out of 115 economies),, central and Eastern European countries are going their own sweet way. Most of them, lacking market potential given their size, focused their efforts on infrastructure, connectivity and knowledge. Who were the best performers? Estonia, already a star model of economic and structural reform in the region, has also become a European model for digitalization at the business and state level. It maintained its first position in the region (26th rank), closely followed by Czechia (27th) and Slovenia (31st).  These three are also the most advanced economies in Central and Eastern Europe in terms of gross national income per capita. The strongest improvers in 2019 compared to 2018 were Bulgaria (gaining +11 places to rank 47), Serbia (+7 to rank 50), Hungary (+5 to rank 24) and Slovenia (+4 to rank 31). Yet, the three youngest EU members from the region, Croatia (rank 49), Romania (56) and Bulgaria, are still trailing the other regional EU members and even Russia (rank 37). However these countries have the potential to improve their position in the ranking by improving regulation.


Latin America: a mixed picture
In Latin America, countries are placed between 39 (Chile) to 107 (Venezuela) in our 2019 ranking. This year showed a significant improvement in connectivity as internet penetration and secure servers gained ground. Chile gained four places, and Colombia and Brazil gained three (at the 66th and 59th places, respectively). Faster growth and political stability in the Andean region attracted more investment, accelerating the digitalization trend. Building on its modest pro-business reform momentum, Brazil bettered its regulation score. Costa Rica (58th) and Panama (61st), despite their small market sizes, remain well-positioned but lost places to more ambitious reforming countries. Yet, most countries also experienced a decline in their infrastructure score, which drove Mexico down four places (55th) and Argentina down six (65th).


Africa and Middle East: heterogeneous but still lagging behind
South Africa still tops the regional ranking (51st place overall) but has lost five places this year. The culprits are deteriorating infrastructure and knowledge scores. Among the best performers, Tunisia gained eight places (75th). Sub-Saharan African countries at the bottom of the ranking (Cameroon, Madagascar, Mauritania) also exhibited gradual improvement. Yet, Kenya tumbled 11 places to 81st due to a worsening of its infrastructure score and a decline in knowledge, which the regulation boost does not offset. In the Middle East, the UAE tops the regional ranking, earning the 23rd place overall (up from 24th last year). It is followed by Israel at the 29th place and Qatar (36th).

Comparing the EDI with digital adoption: unleashing untapped potential

The EDI does not measure digital adoption or digital activity (the outcomes of digitalization) but rather focuses on the conditions for companies to transform or thrive digitally. In this section, we compare our EDI with digital adoption indicators in the literature and assess the gap between the potential for digitalization and realized digitalization. We identify countries whose potential for digitalization remains fully or partially untapped (relatively high EDI, low adoption).  

We use the following eight digital adoption indicators:

  • The market share of tech companies as a share of GDP, which we computed from Bloomberg data of listed companies
  • The OECD business adoption indicators (2018)[3], namely
  1. Businesses purchasing cloud computing services (%)
  2. Businesses having performed Big Data analysis (%)
  3. Businesses receiving orders through the internet (%)
  4. Businesses that have employed ICT specialists within the last 12 months (%)
  • The International Federation of Robotics’ indicator of robotization, i.e. the number of robots per 10,000 employees
  • The aggregate data on mobile payments from Statista’s digital market outlook. However, this is only available for 10 countries.

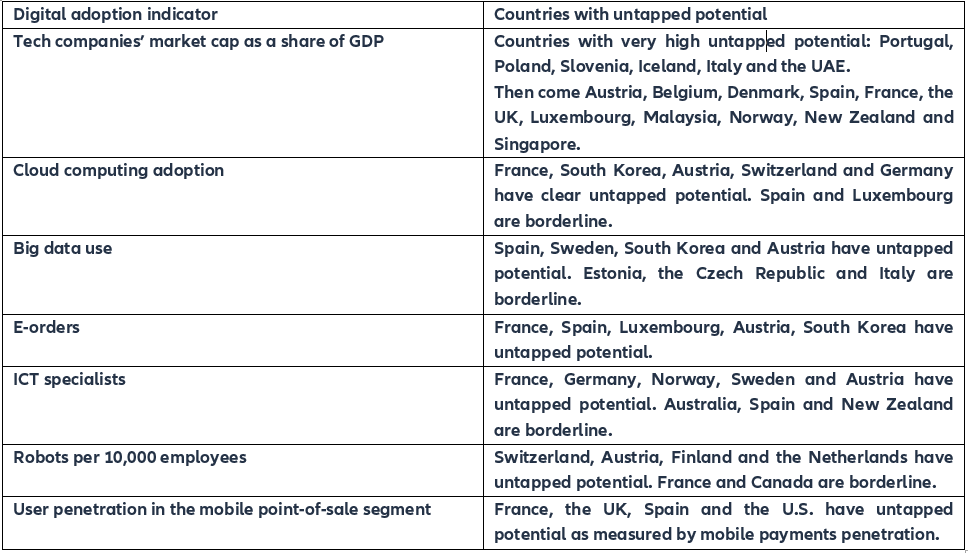
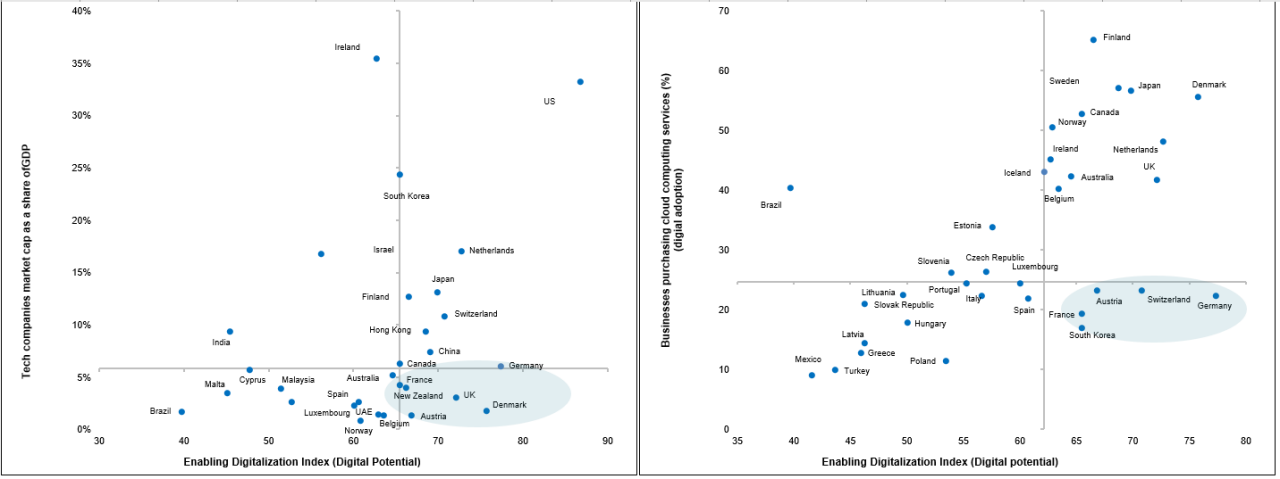
We find that several countries have a lower digital adoption than what the EDI score would predict, indicating untapped potential. These are countries where the Enabling Digitalization Index is high, but companies have not yet fully embraced digitalization.

Figure 2: digital adoption and countries with untapped potential
Sources: OECD, Bloomberg, IFR, Statista, Euler Hermes, Allianz Research
Figure 3: Comparing the EDI with existing digital adoption indicators
Sources: OECD, Bloomberg, IFR, Euler Hermes, Allianz Research

The winning strategy for laggards: focus on knowledge (skills and innovation capability)

We regress our digital adoption indicator against each of the five subcomponents of the EDI to identify those that are significantly correlated with digital adoption. Our findings are almost univocal, yet not so surprising. Out of all subcomponents, knowledge systematically comes back as a key determinant of digitalization: in the case of the tech market cap, the cloud computing, big data and e-orders, the knowledge score, which comprises skills indicators (higher education and training, digital competences) and innovation capabilities (R&D spending, scientific publications) is the most significantly correlated to digital adoption. In the case of robotization as a proxy for digital adoption, the regulation score seems to have the greatest importance.

[1] The methodology can be found in the appendix.

[2] Data found in the Netcraft Secure Server Survey. Websites use secure internet servers when transactions are encrypted (HTTPS).

[3] One caveat is that this dataset concerns mostly OECD countries. Hence the identification of high potential countries will be biased towards OECD countries and partners.

Economist for Latin America, Spain and Portugal
Georges.DIB@eulerhermes.com