Trade Wars: May the Trade Force be with you

Trade Wars: May the Trade Force be with you in 2020 and beyond

November 20 2019
  • Global trade: The force weakens. In 2019, global trade of goods and services could grow at its slowest pace in a decade (+1.5%). Globally, exporters are likely to lose USD420bn. China (-USD67bn), Germany (-USD62bn) and Hong Kong (-USD50bn), as well as the Electronics (-USD212bn), Metals (-USD186bn), and Energy (-USD183bn) sectors, are the main victims of the trade recession. 
  • Will the U.S. and China empires strike back in 2020? The worst could be behind us but despite a slight acceleration we expect global trade to remain in this low-growth regime in 2020 (+1.7%), and our scenario of a Trade Feud continues (see Protectionism: Trade Games, Trade Feud or Trade War?). A superficial “mini-deal” between the U.S. and China, a slowdown in trade in services and a busy political year in 2020 leave no hope for sizable improvement. The sectors software and IT services (USD62bn), agrifood (USD41bn) and chemicals (USD37bn), as well as China (USD90bn) and the U.S. (USD87bn) will see the largest trade gains in 2020 (USD87bn and USD90bn, respectively). However, trade tensions have taken a toll: export gains would be roughly half of what they were in 2018 for both. In addition, Germany and the UK could be targeted by U.S. tariffs on cars.
  • The phantom trade menace. Trade diversion shows that a few winners are capturing export market share to the U.S. (Vietnam, France, the Netherlands and Taiwan) and China (Malaysia, Singapore, Russia  and Saudi Arabia).  However, these winners (like Vietnam) could be next on the hit-list. Meanwhile, phantom trade, whereby companies ship their merchandise to a third market (such as Taiwan, Japan) before exporting it to their trade partner, is unveiling tariff circumvention mechanisms and artificially inflating trade figures. Also note that Trade Tech is reshuffling trade cards in the backdrop: e-commerce platforms and blockchain technology are expected to reduce trade-related costs, while 3D printing could alter the cross-border production process by shortening global value chains, reducing operational risks but decreasing trade flows.
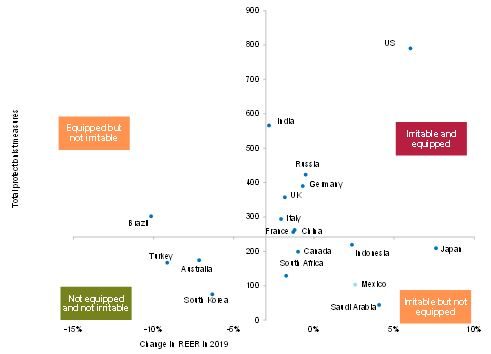
  • The return of the trade Jedis. Pervasive protectionism (~1,290 new trade barriers in 2019, number of new regional trade agreements divided by three and average U.S. tariffs more than doubled since 2017) has pushed countries to sharpen their trade arsenals. We identify countries that are irritable (i.e. could be tempted) and capable to wage trade wars (the U.S., India, Russia, China, France); those that are irritable but not equipped (Japan, Mexico, South Africa) and those that are neither equipped nor irritable (Australia, South Korea). Last, we expect new rules of the game, as part of the shift towards more sustainable trade (regulation of trade transportation and carbon emissions of traded products). Simplifying and considering the EU Border Carbon Adjustment tax (BCA) to be an outright tariff on EU imports, we estimate that a 1% tariff could result in a loss of USD7bn of exports to the EU, affecting Russian, U.S. and Chinese exports.

Global trade outlook in 2020: The force weakens

In 2019, the volume of global trade of goods and services could grow at its slowest pace in a decade (+1.5%, see Figure 1). On top of decelerating global growth (+2.5% in 2019, after +3.1% in 2018), 2pp over two years (2019 and 2020) can be directly attributed to high uncertainty, and higher global tariffs, according to our estimates.
Global trade went into recession end-2018, exiting negative territory only in the fall of 2019. The latest CPB data show that in August, trade of goods in volume stood at a level last seen in November 2018. The automotive and semi-conductor sectors particularly drove this slump. In addition, in H2 2019, trade in services was also affected. The new business sub-component of the Markit Services PMI shows signs of deceleration, and the WTO trade in services barometer predicts a slowdown as early as H2 2019. This explains why services barely compensate for the poor performance of trade in goods. However, the depth of the slowdown will be stronger in countries where services depend more on manufacturing. For example, in Germany, 26% of total national services inputs are used as inputs in industry, against 16% in France, 14% in the U.S. or 11% in the UK.
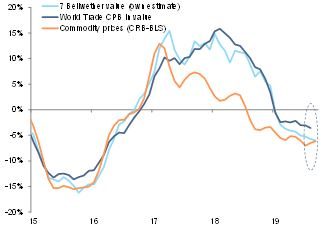
In value terms, trade could have contracted -1.7% in 2019, due to a negative price effect, as illustrated by the drop in commodity prices. Globally, exporters lost USD420bn in 2019. Our bellwether advanced indicator shows still contracting value growth of trade, but a recent stabilization of commodity prices in the last months of this year.  October has seen the first rise in commodity prices since last March, as measured by the Commodity Research Bureau (CRB) – BLS Spot index. This echoes the stabilization we see in oil prices in 2020, as evidenced by our oil forecast of USD66/bbl in 2019 and USD67/bbl in 2020. Hence, while we do not expect a strong rebound of commodity prices, this means the slump could have bottomed out.
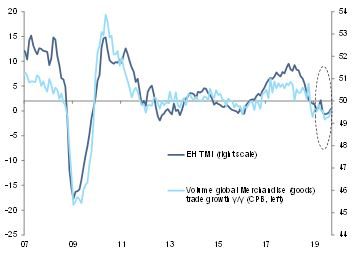
Our proprietary leading indicators show that the worst is behind us. Our Trade Momentum Index (TMI)  has stopped deteriorating, while still remaining in contractionary territory (below 50, see Figure 2). Q3 2019 should be positive overall (around +0.6% q/q, after -0.8% in Q2 and -0.3% in Q1). This would be the first positive quarter since Q3 2018. In other words, we should have technically escaped the recession (i.e. two consecutive quarters in contraction) in trade in Q3.


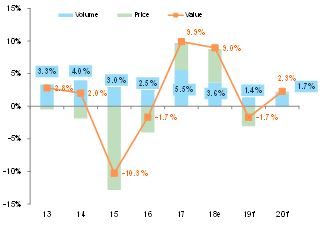
 

Figure 1: Global trade of goods and services, growth in volume and value (%, y/y)
Sources: IHS Markit, Euler Hermes, Allianz Research
Figure 2: Euler Hermes Trade Momentum Index (TMI) and global trade in goods
Sources: IHS markit, CPB, Euler Hermes, Allianz Research
Figure 3: Trade growth in value terms and commodity prices
Sources: IHS Markit, Bloomberg, Euler Hermes, Allianz Research

In 2020, we expect trade to remain in a low-growth regime, slightly accelerating to +1.7%, while the global economy continues to decelerate (+2.4% after +2.5% in 2019). Indeed, a superficial “phase 1” deal between the U.S. and China may bring some comfort but renewed threats of tariffs and a busy political year (global summits and U.S. elections) in 2020 should bring higher volatility, leaving no hope for sizable improvement going forward. Note that in value terms, trade should rebound by +2.3% in 2020 as central banks could help prices recover.

Revenge of the trade Sith: China, the U.S., and Canada; IT services, agrifood and chemicals to see higher export gains in 2020

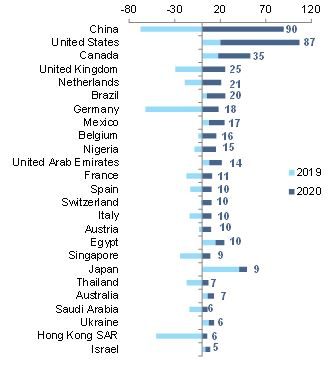
In 2019, China (-USD67bn), Germany (-USD62bn) and Hong Kong (-USD50bn) are the three main victims of the trade recession. Though the currency effects explain most of this, the export shock has clearly been widespread across European countries (the UK, the Netherlands, Spain and France) and export hubs (Singapore, for e.g.). Political risk in the UK and Hong Kong explain their counter performance. Conversely, North America and Japan continue to exhibit positive export gains .

In 2020, the strongest export gains will be seen in China (USD90bn) and the U.S. (USD87bn). However, their trade feud has taken a toll: export gains for both countries would be roughly half of what they were in 2018. Other main winners include Canada (USD35bn), the UK (USD25bn) and the Netherlands (USD21bn). The most notable losers could be India (USD-5bn), South Africa and Sweden (USD-4bn for both).

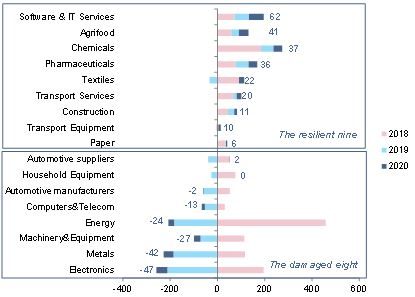
As for sectors, in 2019, electronics (-USD212bn), metals (-USD186bn), and energy (-USD183bn) were the biggest losers. For electronics, blame the price shock on memory semiconductors (-40% in 2019) and lower volumes across most other segments. For both metals and machinery, stable but still low commodity prices, declining volumes due to the broad manufacturing slowdown and trade uncertainty weighed on exports.
For 2020, the electronics (USD -47bn), metals (USD-42bn), machinery and equipment (USD-27bn) sectors will continue to ail. For electronics, the 2019 shock will continue to indent the downstream part of the sector, with limited price effects from 5G-related chips.

In contrast, software and IT services (USD62bn), agrifood (USD41bn) and chemicals (USD37bn) will see moderate export gains. Software and IT services continue on their upward structural trend, mostly driven by the developments in China, although value growth should slow from 17% in 2018 to 12% in 2019 and 11% in 2020. Agrifood exports continue to be underpinned by strong population growth, but are likely to slow down as the outlook for commodity prices is depressed and retail outlets are in disarray. Chemicals exports should also see a sharp slowdown, due to the disarray in their automotive outlets, but remain in positive territory. 

Figure 4: Export gains by country for 2019-20 – top 25
Figure 4: Export gains for 2020 – top 25
Sources: IHS Markit, Euler Hermes, Allianz Research
Figure 5: Export gains by sector in 2018, 2019 and 2020
Figure 5: Export gains by sectors in 2018, 2019 and 2020
Sources: IHS Markit, Euler Hermes, Allianz Research

Will the U.S.-China empires strike back in 2020?

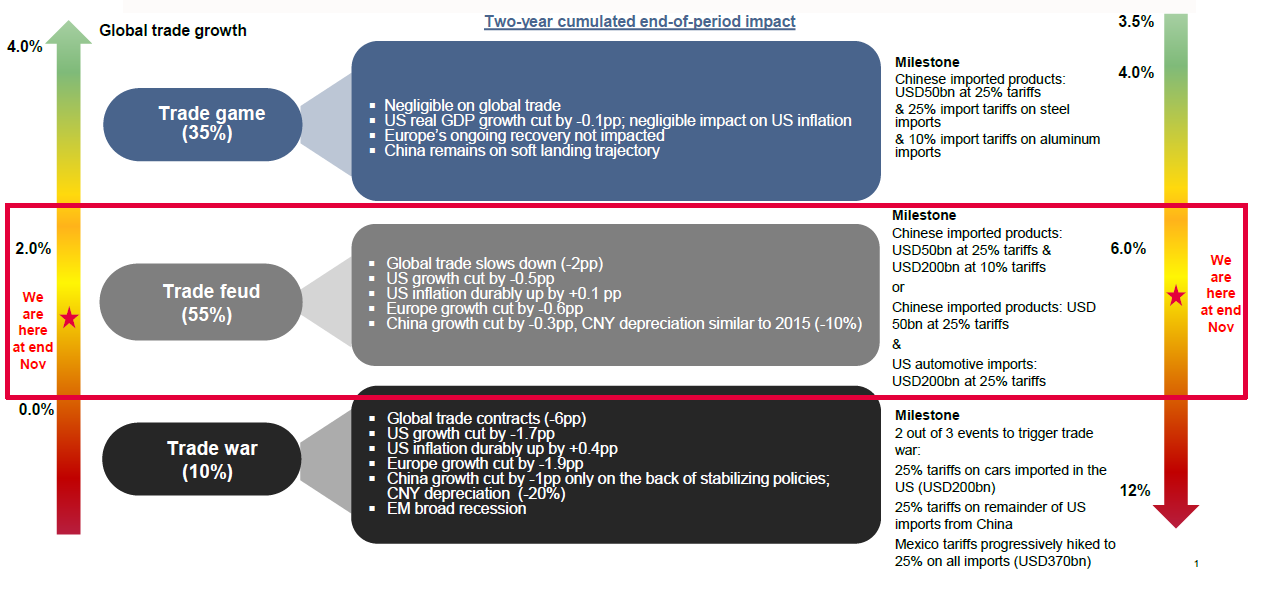
A U.S.-China trade truce (or a “Phase 1” deal between the U.S. and China) only offers a temporary respite to markets and some postponement of tariffs. It is not a game-changer for the global economy. For the last two years, we have been carefully monitoring and analyzing U.S.-China trade tensions and their impacts on the global economy and companies. Our framework is composed of three scenarios: First, a benign “Trade Games” scenario, with negligible economic impacts. From March 2018 to March 2019, the global economy was in this scenario, and we now see a 35% probability of going back to it.  We are currently in the intermediate scenario of a “Trade Feud,” which should remain the case well into 2020 (55% probability). This scenario should subtract -0.5pp from GDP growth in total over 2019 and 2020, and -2pp from trade growth. The worst-case scenario is a “Trade War,” which could trigger a global recession and strongly harm both the U.S. and China’s economies (10% probability).

Figure 6: Trade tensions impact scenarios
Source: Euler Hermes, Allianz Research
Notwithstanding an electoral bifurcation in the U.S. in 2020, the Trade Feud scenario will continue, punctuated by volatile trade announcements. We expect the U.S. to pause its tariff escalation but see no full reversion to the pre-Trump tariff average. In addition, while rumors of overturning previous tariff hikes have emerged, they have been denied by President Trump himself. U.S. tariffs on USD250bn of imported Chinese goods did not increase to 30% on 15 October, but they remained at their 25% level. In addition, the September 15% hike on tariffs on around USD110bn remains in effect. There is an expectation that the 15 December tariffs, which would hit popular consumer items like smartphones and toys (USD160bn of products in total) will not come into effect.
China also made concessions on intellectual property (IP), which are, however, mostly a reiteration of measures already taken (new IP and foreign investment laws, and the new IP courts).
Both countries also put forward bilateral commitments to not manipulate currency markets for economic advantage; as a result the U.S. could remove the “currency manipulator” label it slapped on China in August.
Chinese concessions on buying American goods and on foreign firms’ activity: China has already resumed purchases of soybeans and started buying American pork in large quantities. Although President Trump has set doubling purchases as a goal, the indications are that initially China will simply be buying at levels seen before the trade tensions started.
Other commitments could include China agreeing to buy more American commercial aircraft and natural gas. Although China had already announced this, it also reiterated commitments to lift equity caps on foreign ownership of financial services firms. A dispute resolution mechanism could also be put in place. The next phases – 2, 3 and maybe more – should deal in depth with market access, IP protection, China’s industrial subsidies, U.S. sanctions on Huawei and Chinese surveillance firms. Therefore, we believe we are unlikely to see a comprehensive deal before the 2020 U.S. election: China would rather play the long game, as it is not bound by elections, while President Trump could continue playing on his competitive rivalry with China in his reelection bid next year while claiming a first victory with a mini-deal.
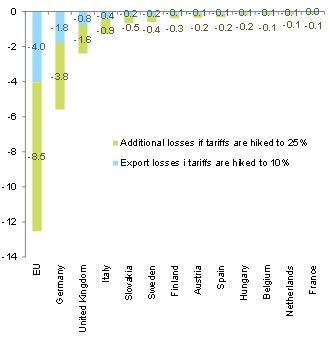
U.S. tariffs on EU car imports tariffs delayed to 2020: Germany and the UK most exposed. It is probable that the U.S. will now turn its trade policy focus to Europe as President Trump has criticized the ECB policy, Germany and the EU overall several times. Moreover, an escalation in tariffs targeting China is rather limited as the most recent tariffs should have a direct impact on the U.S. consumer. However the U.S. has postponed the decision of imposing tariffs on car imports from the EU (currently taxed at 3%). While this reduces uncertainty for now, in six months, President Trump could announce a 10% tariff (from a range of 10%-25%) on imported European cars in the absence of noticeable progress on the U.S.-Europe trade deal. What could be the impact of this? EU growth would be hit by -0.1pp, with Germany hit the hardest in terms of export losses and given the weakness of its automotive sector. Aggregate export losses for the EU would be EUR4bn per year.
Figure 7: Expected annual export losses by country from higher U.S. import tariffs on cars (EURbn)
Sources: ITC, WTO, Euler Hermes, Allianz Research

The Phantom Trade menace

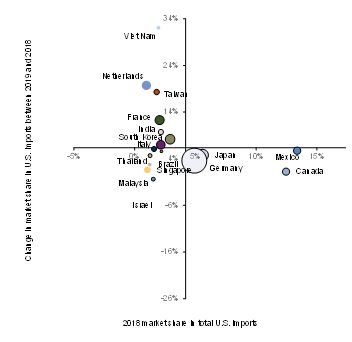
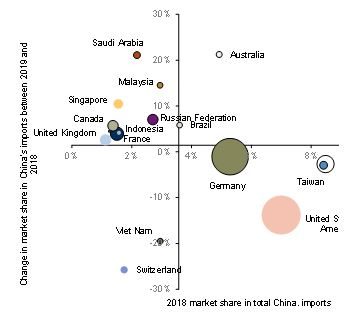
When faced with escalating U.S.-China trade tensions, small and agile exporters benefited the most from trade diversion. We have compared the 2019 change in import market share for both the U.S. and China of their import partners compared to their 2018 level. The main takeaway is that the largest trade partners are losing market share or gaining less than average, while much of the smallest trade partners are rapidly gaining. For instance, China, the U.S.’ largest trade partner, is losing market share. Canada, Germany, Japan and Mexico are all gaining market share at a much slowest rate than average. On the other hand, Taiwan, the Netherlands and France, which are are relatively smaller trade partners, see much more vigorous gains in market shares. The same holds true for China. The U.S., Germany, South Korea, Japan are all the largest import partners of China. and have all seen negative market share growth. However, most smaller partners (France, the UK, Indonesia, Russia, Canada, Malaysia e.g.) have seen above average gains.

Figure 8: 2018 Market share of U.S. imports vs. change in this market share in 2019
Sources: ITC, IHS Markit, Euler Hermes, Allianz Research
Figure 9: 2018 market share of China imports vs. change in this market share in 2019
Figure 9: 2018 market share of China imports vs. change in this market share in 2019;
Sources: ITC, IHS Markit, Euler Hermes, Allianz Research

Winners may not stay winners for long: Vietnam, for instance, which benefited from the trade conflict, is now on the hot seat as its trade surplus with the U.S. has soared. The latest data show Vietnam has gone from the twelfth to the seventh largest goods exporter to the U.S., which could be a case in point of how trade tensions are directing channels of goods and services. Yet, with exports surging, Vietnam’s goods trade surplus with the U.S. soared to USD35.6 billion, up +38% from a year earlier and ranking just behind Germany. As bilateral trade deficits appear to be key factors behind President Trump’s trade irritability, his administration has not wasted time to respond. Shortly before the summer, the U.S. Treasury Department added Vietnam to its watch list for exchange rate manipulation. Tariffs quickly followed: the U.S. imposed 400% on steel imports from Vietnam. 

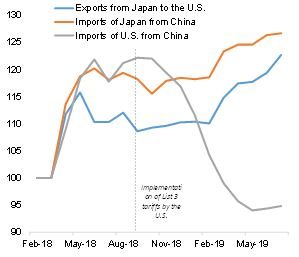
Phantom Trade (companies shipping their merchandise to a third market before exporting to the final destination) is unveiling tariff circumvention mechanisms and artificially inflating trade figures. Recent research (Liu and Shi 2019)  has highlighted tariff circumvention mechanisms that we call “Phantom Trade”. It provides evidence that Chinese exporters rerouted products through third countries/regions to evade U.S. anti-dumping duties between 2002 and 2006. This rerouting avoids tariffs and artificially inflates trade figures (because the same good travels to an additional market before reaching the final partner). Our preliminary analysis on South East Asia, with not more than a year and a half of data, shows that Japan and Taiwan are used as rebound markets for machinery and mechanical appliances, and for electrical machinery. Indeed, while imports of the U.S. from mainland China (in machinery subsectors) decreased after the imposition of tariffs in September 2018, exports from Japan and Taiwan to the U.S. increased. Trade diversion alone cannot explain this phenomenon as production capacity has not magically changed location, nor have providers swapped instantly. Trade rerouting must be part of the equation as imports of the third market from China in the same sector reflects similar growth. Hence, some Chinese companies could simply be creating phantom trade with Taiwan and Japan just to ship their goods to the U.S. and avoid U.S. tariffs.

Figure 10: Phantom trade with Japan in machinery, mechanical appliance
Sources: ITC, Euler Hermes

BOX: Trade tech - A new hope?


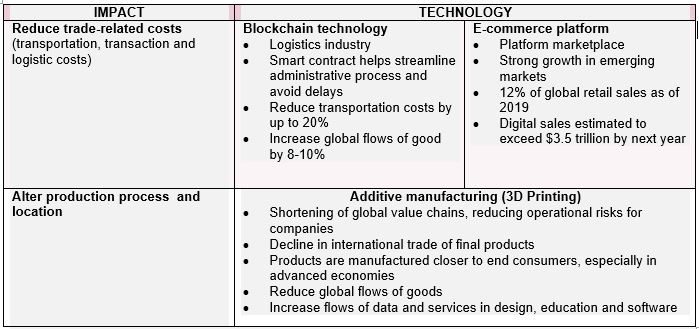
Disruptive technologies are fundamentally transforming existing global value chains by shifting cross-border flows of goods and services. However, the net effect on total trade flows remains complex and unclear. We expect that some of these new technologies will remove trade frictions and facilitate more flows, while others might completely alter the production process as a whole. To fully understand and assess the total effect on trade flows, it is important to identify the two major impacts that new digital technologies bring about and their respective implications.

On one hand, digital advances such as blockchain solutions and e-commerce platforms could significantly reduce transaction costs and subsequently enable more efficient flows of goods and services across borders. According to the WTO, trade costs on goods can be broken down into several components, with transport costs accounting for the largest share at 37%, information and transaction costs at around 20% and logistic costs at 11%. By effectively lowering the above trade-related costs, the global movement of goods is expected to grow an additional 2pp per year over the next decade, relative to the baseline. This development is particularly evident in the logistics industry, where Internet of Things and blockchain technologies have been adopted for real-time tracking of shipments. Blockchain-enabled smart contracts could help streamline administrative processes and prevent unnecessary delays across borders, reducing transportation costs. Several successful pilots have demonstrated that blockchain technologies have great potential in eliminating the friction of customs and paperwork that would otherwise slow down trade flows.

Likewise, digital platforms open up opportunities to access goods and services across borders. By connecting global consumers and producers through a platform marketplace and offering a variety of selections, global e-commerce sites have facilitated substantial trade flows, especially in emerging countries. As of 2019, e-commerce sales make up more than 12% of global retail sales, and this figure is estimated to exceed $3.5 trillion by next year, according to the global shippers alliance.

One the other hand, advanced robotics and additive manufacturing (also known as 3D Printing) are also expected to influence trade flows by changing the mode of production entirely. Even though 3D printing will not in the near future fully replace mass production of goods, scenario analyses show that total trade in manufactured goods could be reduced with 3D printers. There would be a shortening of global value chains and a decline in global trade of final products, since individual parts and products would increasingly be manufactured in the proximity of end consumers. While 3D printing technology is predicted to reduce total trade in manufactured goods over time, flows of services and data such as design, education and software could increase. The overall impact on net trade flows is still ambiguous, but the trends are worth observing. In addition, this could reduce operational risks in a product’s value chain, hence potentially benefiting many companies exposed to such risks when they trade across borders.

Two major impacts that new technologies could create and their implications on trade flows:
Two major impacts that new technologies could create and their implications on trade flows
Sources: WTO, global shippers alliance, Maersk, IBM, AAEI

The return of the trade Jedis

Protectionism is the new normal:

  • For 2019, Global Trade Alert (GTA) shows only a slight decrease from the 2018 record high level in the number of new trade barriers (1,291 in 2019, after 1,382 in 2018; compared to 331 in 2009).
  • The U.S.- China trade dispute has brought the U.S. average tariff to ~8%, close to levels last seen in the 1970s, from 3.5% end-2017, and a higher share of global trade is now being tariffed. Partly in reaction to this trend, the EU has taken  the opposite stance, aggressively promoting its trade model – freer and greener – as evidenced by the implementation of the EU-Japan Free Trade Agreement and the EU- Singapore Free Trade Agreement or the finalization of negotiations of the EU- Vietnam or EU-Mercosur agreement a few months before the end of the European commission’s mandate.
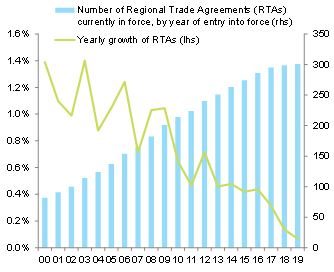
  • Between 2017 and 2019, countries signed three times fewer major regional trade agreements (RTA) than between 2015 and 2017. These are indeed stagnating at around 300 RTAs. In addition, looking at the negotiating periods for the latest EU trade agreements with third parties gives us information about the complexity of issues being addressed and the potential difficulty of  maintaining the pace of new RTAs. South Korea negotiated in less than 3 years, while Japan and Canada negotiated in 5 years, and the Mercosur negotiated in 20 years. The post-Brexit FTA negotiations with the UK could once again be painfully long. For these reasons, bilateralism seems to offer more flexibility to the parties of the agreement, since these agreements are easier to set up and to break. But it is precisely this flexibility that adds uncertainty to international trade. Especially since bilateralism seem to benefit the most powerful countries, which end up having most of the bargaining power of the two parties involved. 
Figure 11: Regional trade agreements entering into force
Sources: WTO, Euler Hermes

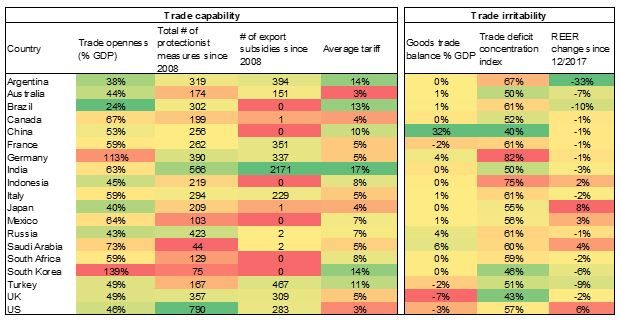
Trade policy is becoming just another political tool for many different policy ends, such as economic diplomacy, geopolitical influence or environmental policy. This activism is not restricted to the U.S: it has spread to Japan and South Korea, India and the EU. This trend is visible both in the questioning of existing treaties (renegotiation of NAFTA, Brexit, Paris Agreement called into question, and challenges for NATO, the RCEP, the TPP or the EU-Mercosur deal) and in the emergence of new bilateral trade agreements (U.S.-China mini-deal, U.S.-Japan agreement, EU- Singapore etc.). It is also visible at the increasing level of geo-politicization of trade agreements. For example, the recent trade pact that Serbia is expected to sign with Russia, as an answer to the EU’s timid opening to the Balkans. We designed a framework to analyze which countries would be most “irritable” or tempted by the trade war in the current tense environment, and which countries would actually be “equipped” for fighting such war.

We identified four groups of countries by trade arsenal:
1. The Ewoks (nor irritable, nor equipped) among them Australia and South Korea,
2. The Stormtroopers (irritable but not equipped) such as Japan, Mexico, South Africa and France); and
3. The Jedis, both irritable and very capable in case of a trade star war like the U.S., China, India and Russia. 
4. The Yodas (equipped but not irritable): in our sample, only Brazil

Figure 12 Comparison of trade capabilities and trade irritability
Sources: IHS, Bloomberg, WTO, GTA, Euler Hermes
Figure 13 Capabilities and irritability of key markets amid trade tensions
Sources: IHS, Bloomberg, WTO, Euler Hermes

BOX: Sustainable trade -  The trade Death Star?

In the medium term, we expect new rules of the game, as part of the shift towards more sustainable trade, to impact trade.
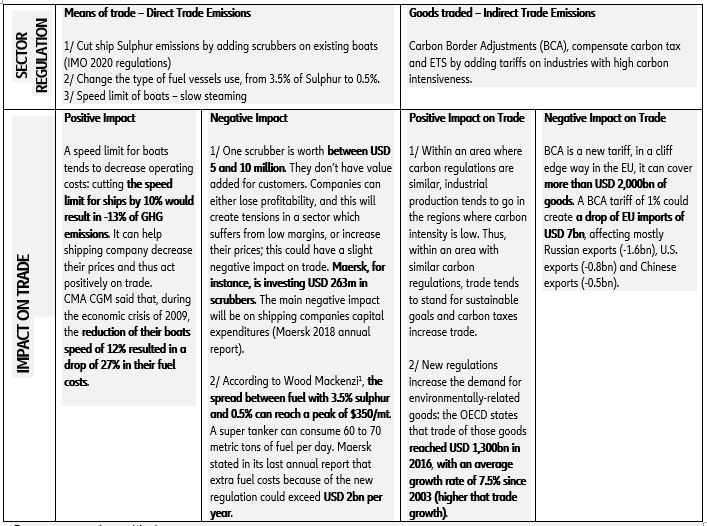
First, regulation of trade transportation: stricter limits on ship speed would be cost savers, but the need for new equipment could pressure already highly indebted transport companies. The shipping industry generates between 2% and 3% of global greenhouse gas emissions. Yet there are also indirect emissions from trade, as it enables producers to set up their factories in the cheapest location, which can be where regulations are less constraining. Thus, within an area where carbon regulations are not similar, industrial production tends to go in the regions where carbon intensity is high2
Second, regulation on the carbon emissions of traded products. Simplifying and considering the EU Border Carbon Adjustment tax (BCA) to be an outright tariff on EU imports, we estimate that a 1% tariff could result in a loss of USD7bn of exports to the EU, affecting Russian, U.S. and Chinese exports. At the same time, such a tax could enhance the competitiveness of EU companies, while increasing the demand for environmentally friendly substitutes.


Impacts of the shift to a more sustainable model of trade on trade flows and companies:
Tab2
Sources: WTO, IMO, Maersk, CMA CGM, EU Commission,, the OECD
Economist for Latin America, Spain and Portugal
Georges.DIB@eulerhermes.com
Chief Economist
Ludovic joined Euler Hermes as Chief Economist in 2011. He also heads macroeconomic and thematic research for Allianz SE globally since 2017. Ludovic sits on the Board of Directors of Solunion, Euler Hermes’ joint venture company for Spain and Latin America.
Research Assistant